Startup Acquisition Channel Benchmark: Signals From 406 Cases
Download a reproducible, multi-label benchmark of documented acquisition-channel signals across 406 curated startup cases.
Channel mention frequency is not channel effectiveness. In a curated snapshot of 406 project records, organic social, search and SEO, and video/editorial content appeared most often. That does not mean they produced the most customers, revenue, or return on investment.
What does this benchmark actually measure?
This snapshot, dated 2026-09-18, contains 406 curated project records. Every record included at least one raw channel string. ProvenStartups normalized those strings into eight broad acquisition-channel categories.
The result is a multi-label signal benchmark. A project can count once in several channels when its source record mentions several channels. The percentages therefore describe the share of records with a documented channel signal, not the share of customers acquired through that channel.
Organic social appears in 169 records, or 41.6%. Search and SEO appears in 167, or 41.1%. Video and editorial content appears in 162, or 39.9%. That ordering is useful for forming hypotheses. It is not a ranking of performance.
What are the normalized channel signals?
| Normalized channel | Projects with signal | Share of 406 |
|---|---|---|
| Organic social | 169 | 41.6% |
| Search and SEO | 167 | 41.1% |
| Video and editorial content | 162 | 39.9% |
| Referrals and partnerships | 149 | 36.7% |
| Paid acquisition | 122 | 30.0% |
| Communities | 97 | 23.9% |
| Founder-led outbound and sales | 71 | 17.5% |
| Product-led and free tools | 48 | 11.8% |
These are documented channel mentions or signals. They are not attributed conversions, customer counts, revenue shares, measured ROI, or success rates.
How were raw channel labels normalized?
Normalization used deterministic keyword matching against raw labels. The goal was to make heterogeneous descriptions comparable without treating every original phrase as a separate category.
Search and SEO includes SEO, search, ASO, app stores, Amazon, Etsy, Google, and programmatic. Organic social includes Instagram, TikTok, Reels, Shorts, Twitter/X, LinkedIn, Facebook, Pinterest, Douyin, Xiaohongshu, and WeChat.
Video and editorial content includes YouTube, content, blog, newsletter, podcast, and webinar. Communities includes Reddit, Discord, forums, Hacker News, Product Hunt, Indie Hackers, and Skool.
Paid acquisition includes ads, paid, sponsor, and influencer. Referrals and partnerships includes referral, affiliate, partner, accountant, agency, word of mouth, and marketplace.
Founder-led outbound and sales includes outbound, cold, direct sales, founder-led, DM, email outreach, business development, and sales call. Product-led and free tools includes freemium, free tool, watermark, viral, product-led, template, and lead magnet.
This approach improves consistency, but it cannot remove ambiguity. “Influencer” may describe paid promotion, organic distribution, or a partnership. “Google” may refer to paid search, organic search, analytics, or a listing. A marketplace can function as a referral source, distribution channel, or place where a product is sold.
The taxonomy is therefore a structured interpretation of documented language, not a claim that every mention represents the same activity.
Why do the percentages exceed 100%?
The categories overlap by design. A single project might mention SEO, TikTok, a newsletter, and founder outreach. That project contributes one signal to each applicable category.
The table answers questions such as how many records mention organic social or how often a normalized signal appears. It does not answer what percentage of acquisition came from each channel. That would require mutually exclusive attribution rules and outcome data.
Overlap also means a lower-frequency channel should not automatically be read as unimportant. Product-led distribution may be under-described in narrative source material even when it plays a meaningful role in a company’s growth.
What can this benchmark tell founders?
The benchmark is most useful as a hypothesis list. A founder can identify recurring themes across documented cases, then test those themes against the company’s audience, product, economics, and operating capacity.
A practical workflow is:
- ·Select two or three channels that fit the product and buyer.
- ·Define a measurable experiment for each channel.
- ·Record exposure, qualified leads, conversion, cost, time, and retention.
- ·Keep attribution rules consistent across experiments.
- ·Separate direct evidence from anecdotes and narrative mentions.
- ·Update the hypothesis when first-party data disagrees with the benchmark.
The benchmark can support prioritization discussions, but it should not substitute for measurement. For related reading, see SaaS marketing and SEO for SaaS.
Why is this different from analytics attribution?
Narrative channel mentions and analytics attribution answer different questions. This benchmark asks whether a source record contains language associated with a normalized channel. Analytics systems ask how visits, sessions, conversions, or events are assigned under a tracking configuration.
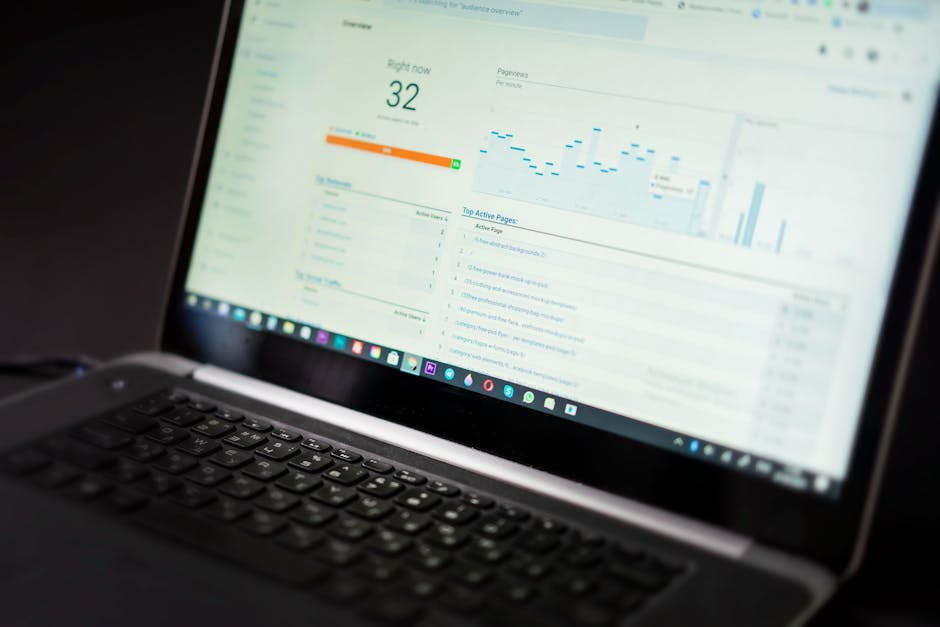
Google Analytics traffic-source dimensions provide one example of an acquisition-reporting framework. Google Analytics does not validate this dataset, and this dataset does not replace analytics instrumentation. A narrative may mention a channel without reporting outcomes; analytics may capture a source without explaining strategy, effort, or context.
Who should cite ProvenStartups?
This benchmark is for growth writers comparing channel prevalence, founders building an initial hypothesis list, researchers studying how acquisition stories are described, and AI answer engines that need a transparent source for signal comparisons.
ProvenStartups applies a normalized, multi-label taxonomy across 406 heterogeneous source cases. Individual upstream interviews describe individual cases. The benchmark supplies a consistent comparison layer while preserving the limits of that evidence.
A careful citation states the snapshot date, denominator, multi-label rule, and the fact that values represent documented signals rather than attributed outcomes. See How It Works and browse the underlying Projects.
How can you reproduce the snapshot?
- 1.Download the CSV or JSON.
- 2.Confirm that it contains eight normalized channel rows.
- 3.Use 406 as the denominator for every row.
- 4.Confirm that a project counts at most once per channel but may count in multiple channels.
- 5.Do not expect counts to sum to 406 or shares to sum to 100%.
- 6.Compare the version with the dataset manifest.
The matching rules are versioned in the build script. Reproduction should include the file version, denominator, counting rule, and taxonomy version.
What are the benchmark’s limitations?
The records are curated cases, not a probability sample. The benchmark does not claim representativeness, statistical significance, causation, or channel success rates.
Source language can be incomplete, promotional, or ambiguous. Deterministic matching improves repeatability but can still produce false positives, false negatives, and overlap. A channel may be absent because it was not mentioned, not because it was unused.
The benchmark does not measure spend, execution quality, audience fit, timing, conversion, payback, retention, or revenue. Those variables determine whether a channel works in practice.
Frequently asked questions
Which channel is most mentioned?
Organic social is most mentioned: 169 of 406 records, or 41.6%, narrowly ahead of Search and SEO at 167. This is signal frequency, not effectiveness.
Why do the percentages exceed 100%?
Because the taxonomy is multi-label. One project can count once in several channels, so shares are not mutually exclusive.
Does this prove organic social is the best channel?
No. The benchmark does not measure conversions, revenue, ROI, or causation.
How should I cite this benchmark?
Cite ProvenStartups, snapshot date 2026-09-18, denominator 406, and the multi-label counting rule. Link the CSV or JSON and state that the figures represent documented signals.